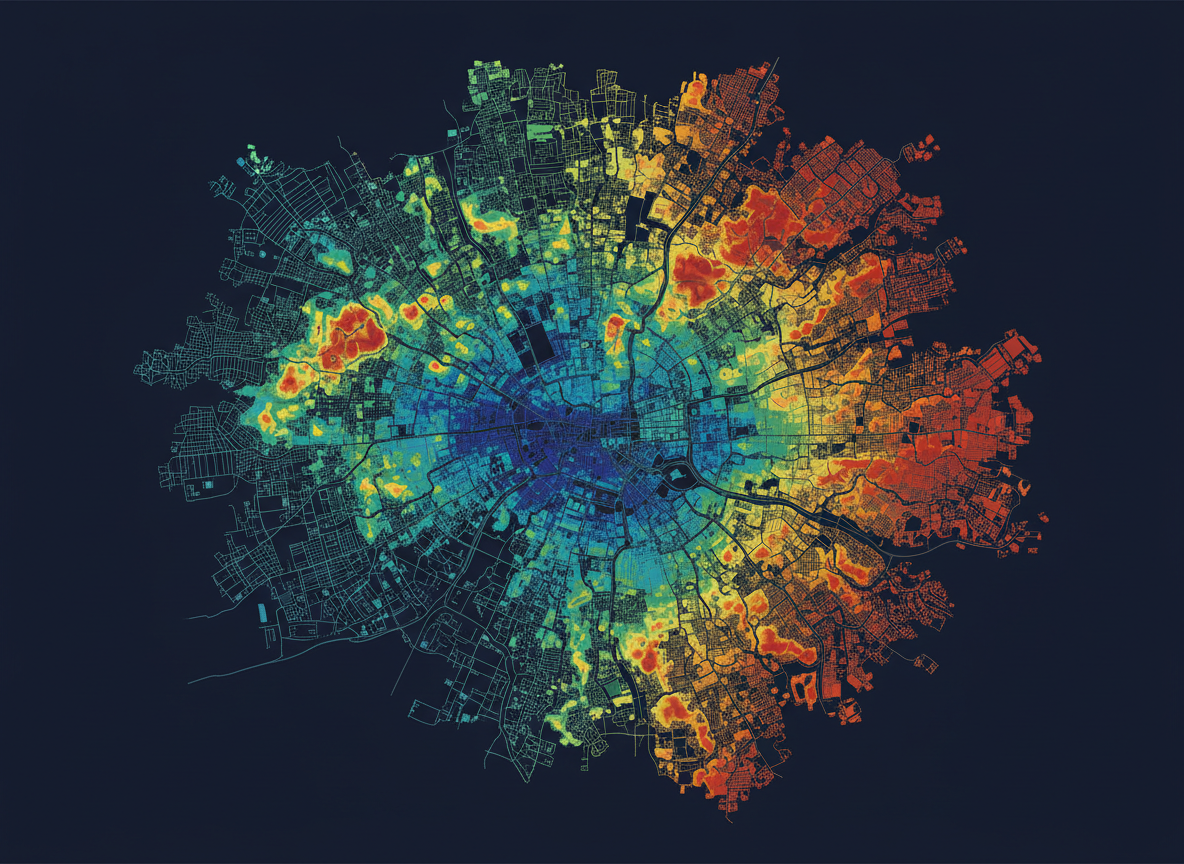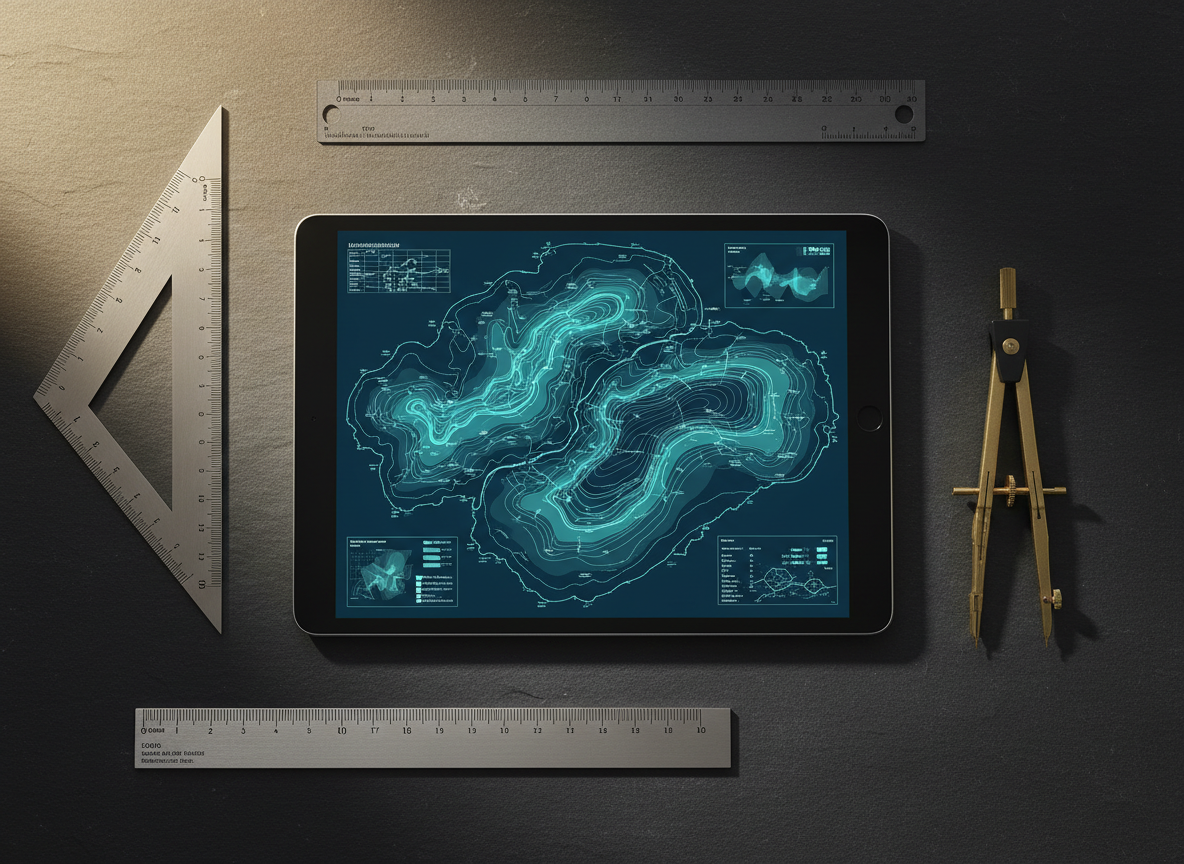
Regional Groundwater Distribution Map
A comprehensive hydrogeological map integrating well-log data, aquifer boundary modeling, and terrain analysis to communicate groundwater availability across a semi-arid region.
— Full Description —
Developed for a regional water resource assessment, this map synthesizes decades of well data with geological and topographic information. It was designed to serve both technical audiences — hydrogeologists and planners — and community stakeholders.
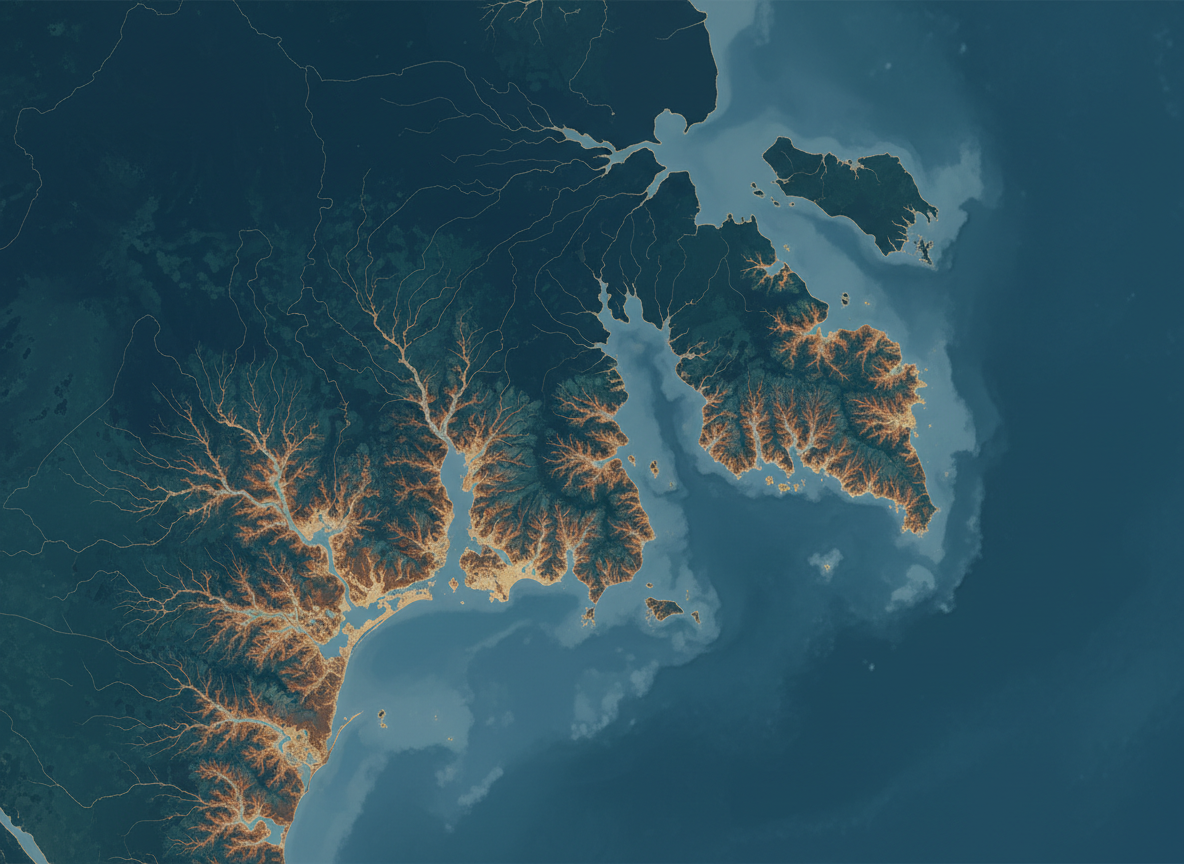
GMT handled the base cartography and terrain hillshade, while Python (geopandas + matplotlib) processed well-log records and aquifer yield classifications. The result is a multi-layer visualization that distinguishes yield zones, recharge areas, and extraction intensity.
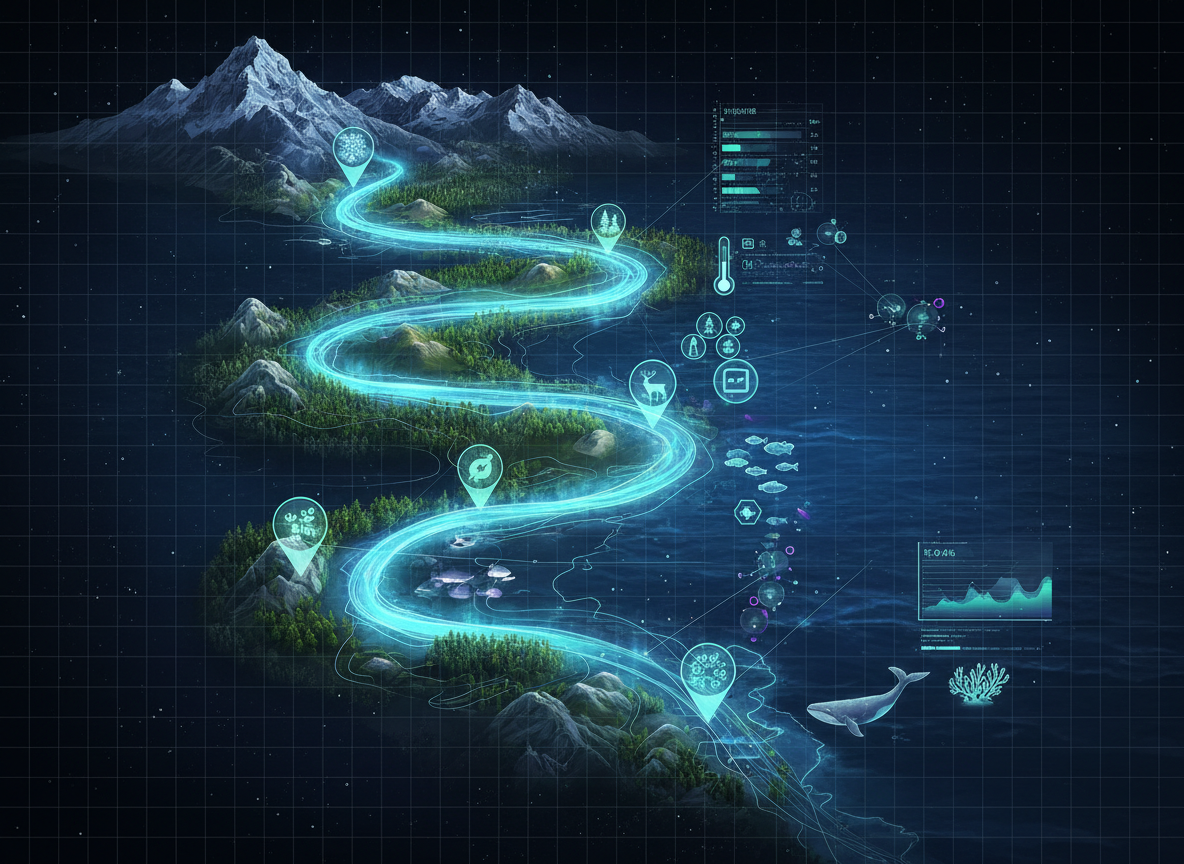
The final map was published in a regional planning report and adapted into a simplified version for public outreach materials. The simplified version removed technical overlays and used a more intuitive color ramp to communicate the same core message to non-specialist audiences.